

![]()
Body weight data obtained prior to departure from Iquitos, on arrival, and after a 30 day observation period (Table I) were grouped according to transit time, age, and sex. Transit times for the nine ship ments were consolidated into groups of 3 to 4 days (Group A), 6 to 7 days (Group B), and 9 to 14 days (Group C).
For analysis, data were transformed to show per cent changes in weights (Tables II, III, and IV) during shipment, during the 30day observation pe riod, and between departure and the end of the 30day observation period. Data were examined us ing the analysis of variance technique. Because the numbers of juveniles in groups A and C were small, their data were not used for analysis.
Body weight loss during shipping
Shipping resulted in significant weight loss for all groups examined (Table 11). Analysis of these data showed no significant difference in weight loss between sexes, nor within age groups, for the different transit times. However, significant differences were found when consideration was given to both age and time in transit: weight loss in subadults, was greater than weight lost in adults for all groups. This difference was statistically significant (P < 0.05) for animals in B and C groups (Fig. 1). Weight loss in juveniles did not differ significantly from that of subadults in B group.
Body weight changes between arrival and the end of the 30day observation period
Analysis of weight changes occurring between ar rival and the end of the 30day observation period
Table II. Percent weight change (mean ± SD) between departure and arrival of 450 owl monkeys (Aotus nancymai) shipped from Iquitos, Peru to Richland, Washington.
|
Days in transit
|
||||||||||
|
Group A1
|
Group B2
|
Group C3
|
||||||||
| Age |
Sex
|
N
|
Mean
|
SD
|
N
|
Mean
|
SD
|
N
|
Mean
|
SD
|
| Adults |
F
|
31
|
-3.36
|
1.29
|
66
|
-5.64
|
0.49
|
41
|
-4.79
|
1.31
|
|
M
|
33
|
-5.2
|
0.72
|
67
|
-5.40
|
0.57
|
37
|
-2.95
|
1.21
|
|
| Total |
|
64
|
-4.31
|
0.73
|
133
|
-5.52
|
0.38
|
78
|
-3.92
|
0.89
|
|
|
|
|
|
|
|
|
|
|
|
|
| Subadults |
F
|
22
|
-6.91
|
0.93
|
13
|
-7.32
|
0.78
|
18
|
-6.57
|
2.02
|
|
M
|
18
|
-5.21
|
1.29
|
10
|
-7.00
|
0.68
|
21
|
-6.24
|
2.69
|
|
| Total |
|
40
|
-6.15
|
0.78
|
23
|
-7.18
|
0.52
|
39
|
-6.39
|
1.9
|
|
|
|
|
|
|
|
|
|
|
|
|
| Juveniles |
F
|
1
|
-6.34
|
|
26
|
-6.29
|
0.72
|
3
|
-1.87
|
3.18
|
|
M
|
3
|
-8.05
|
5.09
|
19
|
-8.96
|
1.33
|
6
|
-9.76
|
2.53
|
|
| Total |
|
4
|
-7.63
|
0.72
|
45
|
-7.42
|
0.72
|
9
|
-7.13
|
2.29
|
1Group A = 34 days in transit.
2Group B = 67 days in transit.
3Group C = 914 days in transit.
Table III. Percent weight change (mean ± SD) between arrival and 30 days after arrival of 450 owl monkeys (Aotus nancymai) shipped from Iquitos, Peru to Richland, Washington.
|
Days in transit
|
||||||||||
|
Group A1
|
Group B2
|
Group C3
|
||||||||
| Age |
Sex
|
N
|
Mean
|
SD
|
N
|
Mean
|
SD
|
N
|
Mean
|
SD
|
| Adults |
F
|
31
|
-3.36
|
1.29
|
66
|
-5.64
|
0.49
|
41
|
-4.79
|
1.31
|
|
M
|
33
|
-5.2
|
0.72
|
67
|
-5.40
|
0.57
|
37
|
-2.95
|
1.21
|
|
| Total |
|
64
|
-4.31
|
0.73
|
133
|
-5.52
|
0.38
|
78
|
-3.92
|
0.89
|
|
|
|
|
|
|
|
|
|
|
|
|
| Subadults |
F
|
22
|
-6.91
|
0.93
|
13
|
-7.32
|
0.78
|
18
|
-6.57
|
2.02
|
|
M
|
18
|
-5.21
|
1.29
|
10
|
-7.00
|
0.68
|
21
|
-6.24
|
2.69
|
|
| Total |
|
40
|
-6.15
|
0.78
|
23
|
-7.18
|
0.52
|
39
|
-6.39
|
1.9
|
|
|
|
|
|
|
|
|
|
|
|
|
| Juveniles |
F
|
1
|
-6.34
|
|
26
|
-6.29
|
0.72
|
3
|
-1.87
|
3.18
|
|
M
|
3
|
-8.05
|
5.09
|
19
|
-8.96
|
1.33
|
6
|
-9.76
|
2.53
|
|
| Total |
|
4
|
-7.63
|
0.72
|
45
|
-7.42
|
0.72
|
9
|
-7.13
|
2.29
|
1Group A = 34 days in transit.
2Group B = 67 days in transit.
3Group C = 914 days in transit.
Table IV. Percent weight change (mean ± SD) between departure and 30 days after arrival of 450 owl monkeys (Aotus nancymai) shipped from Iquitos, Peru to Richland, Washington.
|
Days in transit
|
||||||||||
|
Group A1
|
Group B2
|
Group C3
|
||||||||
| Age |
Sex
|
N
|
Mean
|
SD
|
N
|
Mean
|
SD
|
N
|
Mean
|
SD
|
| Adults |
F
|
31
|
5.96
|
1.05
|
66
|
1.2
|
1.43
|
41
|
3.09
|
1.11
|
|
M
|
33
|
4.94
|
1.45
|
67
|
1.95
|
1.68
|
37
|
3.43
|
1.11
|
|
| Total |
|
64
|
5.53
|
0.91
|
133
|
1.58
|
1.1
|
78
|
3.25
|
0.78
|
|
|
|
|
|
|
|
|
|
|
|
|
| Subadults |
F
|
22
|
5.5
|
3.21
|
13
|
14
|
1.64
|
18
|
8.76
|
1.77
|
|
M
|
18
|
6.68
|
1.64
|
10
|
12.63
|
2.35
|
21
|
7.67
|
1.3
|
|
| Total |
|
40
|
6.03
|
1.89
|
23
|
13.41
|
1.35
|
39
|
8.17
|
1.06
|
|
|
|
|
|
|
|
|
|
|
|
|
| Juveniles |
F
|
1
|
20.48
|
|
26
|
11.2
|
1.16
|
3
|
8.98
|
3.96
|
|
M
|
3
|
18.6
|
2.6
|
19
|
13.13
|
1.4
|
6
|
6.48
|
1.17
|
|
| Total |
|
4
|
19.07
|
1.9
|
45
|
12.02
|
0.9
|
9
|
7.31
|
1.43
|
1Group A = 34 days in transit.
2Group B = 67 days in transit.
3Group C = 914 days in transit.
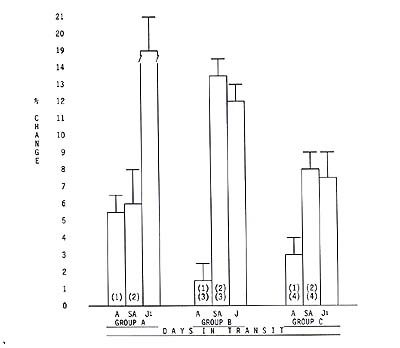
Fig. 1. Mean percent weight loss, by
age and days in transit, of 450 Aotus nancymai shipped from Iquitos,
Peru to Richland, Washington, U.S.A. Group A, 34 days in transit; group B, 67
days in transit; group C, 914 days in transit. A, adult; SA, subadult; J, juveniles.
Numbers in parentheses indicate significant difference between columns with
the same numbers (P < 0.05). 1 number too small to examine statistically.
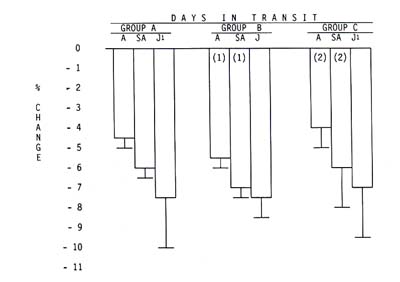
Fig. 2. Mean percent weight change from arrival to 30 days
after arrival, by age and days in transit, of 450 Aotus nancymai
shipped from Iquitos, Peru to Richland, Washington, U.S.A. Group identifications
and symbols as in Figure 1.
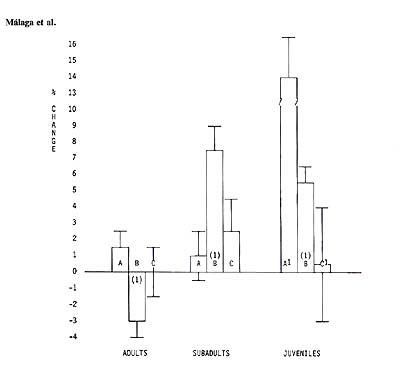
Fig. 3. Weight changes between departure and 30 days after arrival, by age and days in transit, of 450 Aotus nancymai shipped from Iquitos, Peru to Richland, Washington, U.S.A. A, 34 days in transit; B, 67 days in transit; C, 914 days in transit. Numbers in parentheses indicate significant difference between columns with the same numbers (P < 0.05).1 number too small to examine statistically.
(Table III) showed that transit time was a relevantfactor when considering weight recovery after arrival. Significant differences (P < 0.05) in weightgain were observed among groups A, B, and C(Fig. 2) for both adults and subadults. Differencesin percent weight gain between adults and subadultsin the same group were significant for both B and C groups, but not in the A group.
Body weight changes between departure and the end ofthe 30day observation period Comparison of weight changes between departure and 30 days after arrival (Table IV) showed no significant difference between initial and final weights for adults or subadults in either the A or the C groups. However, weight changes during thisperiod were significant (Fig. 3) for both adults and subadults in the B group.
Mortality
Mortality occurring in transit, during the 30day observation period, and overall (Table V), was considered small. Intransit mortality between Iquitos and Richland was 0.67%; mortality during the 30day observation period was 1.78%; overall mortality from shipment in Iquitos to the end of the 30day observation period was 2.44%. No significant association between mortality and age, sex, or transit time was evident, nor were any necropsy findings consistent.
